istio 스터디 2주차 내용을 정리하였다.
Istio 프록시의 실제 동작 도구인 Envoy 프록시에 대한 내용과 secure istio에 대한 내용을 다루었다.
그럼시작한다.
Envoy란 ?

Envoy는 원래 Lyft에서 개발된 고성능 오픈소스 프록시(proxy)입니다. 주로 마이크로서비스 아키텍처에서 서비스 간 트래픽을 중계하고, 로드밸런싱, 서비스 디스커버리, TLS 암호화, 서킷 브레이커, 트래픽 라우팅, 모니터링 등 다양한 네트워크 기능을 제공한다. Envoy의 가장 큰 특징은 API 기반의 실시간 설정 업데이트와 뛰어난 가시성과 성능이다.
istio가 Envoy 프록시를 사이드카로 활용하여 서비스 메시를 구현하고, 트래픽 관리·보안·모니터링 등 다양한 기능을 제공하는 오픈소스 플랫폼이기 때문에 Envoy 프록시를 필히 알아야 한다.
Envoy의 가장 큰 장점은 동적 구성(Dynamic Configuration)과 API 기반 관리이다.
이 장점 덕분에 실시간으로 프록시 설정(트래픽 라우팅, 보안 정책, 로드밸런싱 등)을 변경할 수 있고, 서비스 중단 없이 네트워크 정책을 빠르게 반영할 수 있다.
예를 들어, 대규모 마이크로서비스 환경에서 특정 서비스에 장애가 발생했을 때, 운영자는 Envoy의 xDS API를 통해 실시간으로 트래픽을 우회하거나 라우팅 정책을 수정할 수 있다. 이 과정에서 애플리케이션이나 프록시를 재시작할 필요가 없으므로, 서비스 연속성과 가용성을 향상 시킬 수 있다. DevOps 엔지니어 입장에서는 배포 자동화 파이프라인이나 운영 도구와 연동해 네트워크 정책을 코드로 관리하고, 장애 대응이나 신규 서비스 추가 시에도 빠르고 유연하게 대응할 수 있다.
Envoy 실습

docker pull envoyproxy/envoy:v1.19.0
docker pull curlimages/curl
docker pull mccutchen/go-httpbin

# mccutchen/go-httpbin 는 기본 8080 포트여서, 책 실습에 맞게 8000으로 변경
# docker run -d -e PORT=8000 --name httpbin mccutchen/go-httpbin -p 8000:8000
docker run -d -e PORT=8000 --name httpbin mccutchen/go-httpbin
docker ps

# curl 컨테이너로 httpbin 호출 확인
docker run -it --rm --link httpbin curlimages/curl curl -X GET http://httpbin:8000/headers
여기까지는 envoy를 타지않고 httpbin 컨테이너로 바로 접속한 모습이다.
admin:  # Envoy 관리 인터페이스 설정
  address:  # 관리 인터페이스 주소 구성
    socket_address: { address: 0.0.0.0, port_value: 15000 }  # 모든 IP에서 15000 포트로 관리 인터페이스 개방

static_resources:  # 정적 리소스 정의(리스너, 클러스터 등)
  listeners:  # 트래픽 수신을 위한 리스너 목록
  - name: httpbin-demo  # 리스너 식별 이름
    address:  # 리스너 바인딩 주소
      socket_address: { address: 0.0.0.0, port_value: 15001 }  # 모든 IP에서 15001 포트로 트래픽 수신
    filter_chains:  # 필터 체인 구성
    - filters:  # 네트워크 필터 목록
      - name:  envoy.filters.network.http_connection_manager  # HTTP 연결 관리 필터 사용
        typed_config:  # 타입 지정 구성
          "@type": type.googleapis.com/envoy.extensions.filters.network.http_connection_manager.v3.HttpConnectionManager  # gRPC API 타입 지정
          stat_prefix: ingress_http  # 메트릭 접두사 설정
          http_filters:  # HTTP 필터 스택
          - name: envoy.filters.http.router  # 라우터 필터 사용(기본 요청 라우팅)
          route_config:  # 라우팅 구성
            name: httpbin_local_route  # 라우트 구성 이름
            virtual_hosts:  # 가상 호스트 목록
            - name: httpbin_local_service  # 가상 호스트 이름
              domains: ["*"]  # 모든 도메인 매칭
              routes:  # 라우팅 규칙 목록
              - match: { prefix: "/" }  # 모든 경로(/로 시작) 매칭
                route:  # 라우팅 대상 설정
                  auto_host_rewrite: true  # 업스트림 호스트 헤더 자동 재작성
                  cluster: httpbin_service  # 타겟 클러스터 지정
  clusters:  # 업스트림 서비스 클러스터 정의
    - name: httpbin_service  # 클러스터 이름
      connect_timeout: 5s  # 연결 타임아웃 설정(5초)
      type: LOGICAL_DNS  # DNS 기반 서비스 디스커버리 사용
      dns_lookup_family: V4_ONLY  # IPv4 전용 DNS 조회
      lb_policy: ROUND_ROBIN  # 라운드 로빈 로드 밸런싱 정책
      load_assignment:  # 엔드포인트 할당 정보
        cluster_name: httpbin  # 대상 클러스터 이름(실제 서비스 이름)
        endpoints:  # 엔드포인트 그룹
        - lb_endpoints:  # 로드밸런싱 대상 엔드포인트
          - endpoint:  # 단일 엔드포인트 설정
              address:  # 대상 주소
                socket_address:  # 소켓 주소 지정
                  address: httpbin  # 서비스 도메인 주소(httpbin)
                  port_value: 8000  # 대상 포트(8000)
위의 설정파일을 사용하여 엔보이를 실행시킨다.
그리고 다음 명령어로 envoy
docker run --name proxy --link httpbin envoyproxy/envoy:v1.19.0 --config-yaml "$(cat ch3/simple.yaml)"그다음 다시 다음 명령어로 엔보이 컨테이너로 붙어본다.
docker run -it --rm --link proxy curlimages/curl curl -X GET http://proxy:15001/headers그럼 다음 화면처럼 아까완 다른 헤더값
- X-Envoy-Expected-Rq-Timeout-Ms
- X-Request-Id
들이 추가되면서 결국 httpbin 의 결과가 출력되는것을 알 수 있다. 이는 곧 엔보이 프록시를 통해 httpbin 컨테이너에 접속된것을 알 수 있다.

이것들은 envoy의 설정을 바꾸면 해당값도 바뀐다.
              - match: { prefix: "/" }
                route:
                  auto_host_rewrite: true
                  cluster: httpbin_service
                  timeout: 1s
보는것처럼 타임아웃 값이 1.5초에서 1초로 바뀐것을 알 수 있다.
# 추가 테스트 : Envoy Admin API(TCP 15000) 를 통해 delay 설정
docker run -it --rm --link proxy curlimages/curl curl -X POST http://proxy:15000/logging
docker run -it --rm --link proxy curlimages/curl curl -X POST http://proxy:15000/logging?http=debug

docker run -it --rm --link proxy curlimages/curl curl -X GET http://proxy:15001/delay/0.5
docker run -it --rm --link proxy curlimages/curl curl -X GET http://proxy:15001/delay/1
docker run -it --rm --link proxy curlimages/curl curl -X GET http://proxy:15001/delay/2
upstream request timeout
위와같이 현재 엔보이 프록시의 로그 설정을 확인할 수 있고 또 debug 모드로도 변경할 수 있다.
그리고 아까 타임아웃을 1초로 해둔 상태인데, delay를 0.5와 1초 했을 때의 결과를 다음과같이 확인 할 수 있다.

Envoy's Admin API를 사용하면 프록시 동작에 대해 이해할 수 있고 메트릭과 설정에 접근 할 수 있다.
docker run -it --rm --link proxy curlimages/curl curl -X GET http://proxy:15000/stats/prometheus # 엔보이 통계(프로메테우스 레코드 형식)특히 위와같은 접근으로 프로메테우스 형식의 메트릭을 접근할 수 있다.
이를 활용하여 이스티오 관련 모니터링 대시보드를 만들 수 있을것이다. 예를들면 다음과 같다.

https://grafana.com/orgs/istio/dashboards
[istio Dashboards | Grafana Labs
uploaded on February 28, 2020 Downloads: 33513582 Reviews: 0
grafana.com](https://grafana.com/orgs/istio/dashboards)
docker rm -f proxy

#
cat ch3/simple_retry.yaml
docker run -p 15000:15000 --name proxy --link httpbin envoyproxy/envoy:v1.19.0 --config-yaml "$(cat ch3/simple_retry.yaml)"
docker run -it --rm --link proxy curlimages/curl curl -X POST http://proxy:15000/logging?http=debug

# /stats/500 경로로 프록시를 호출 : 이 경로로 httphbin 호출하면 오류가 발생
docker run -it --rm --link proxy curlimages/curl curl -X GET http://proxy:15001/status/500

# 호출이 끝났는데 아무런 응답도 보이지 않는다. 엔보이 Admin API에 확인
docker run -it --rm --link proxy curlimages/curl curl -X GET http://proxy:15000/stats | grep retry
위 스크립트는 1주차때 진행했던 500 에러 발생시 재시도 하는 테스트이다.

앞선 1주차때 했떤 이스티오 설정과 동일하게 엔보이에서도(당연히) 3회 시도에 대한 메트릭을 확인할 수 있다.
Summary
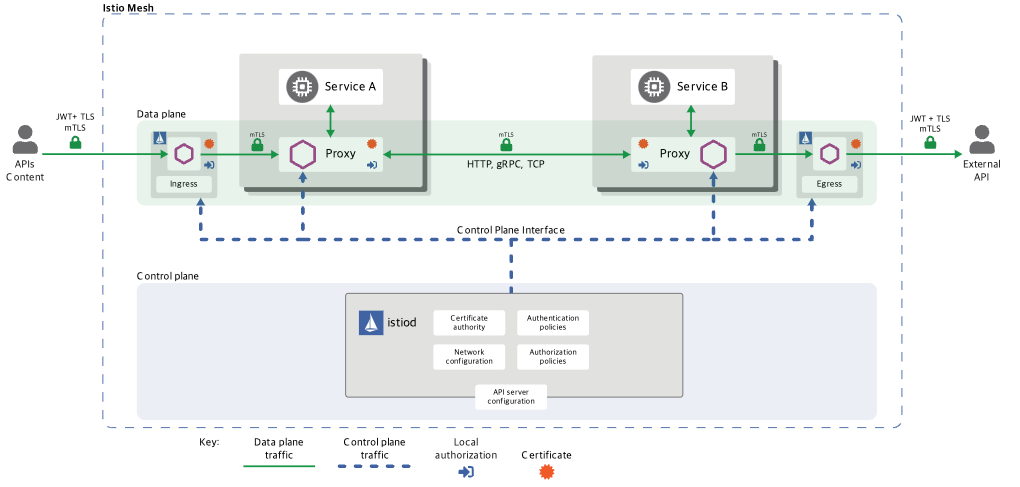
- Envoy는 애플리케이션이 애플리케이션 수준의 동작에 사용할 수 있는 프록시입니다.
- Envoy는 이스티오의 데이터 플레인입니다.
- Envoy는 클라우드 신뢰성 문제(네트워크 장애, 토폴로지 변경, 탄력성)를 일관되고 정확하게 해결하는 데 도움을 줄 수 있습니다.
- Envoy는 런타임 제어를 위해 동적 API를 사용합니다(Istio는 이를 사용합니다).
- Envoy는 애플리케이션 사용 및 프록시 내부에 대한 강력한 지표와 정보를 많이 노출합니다.
istio 실습
실습 환경 구성
실제 실습을 진행하면서, 추가로 현재 운영중인 istio 환경도 함께 확인해볼 예정이다.
K8s 설치
#
git clone https://github.com/AcornPublishing/istio-in-action
cd istio-in-action/book-source-code-master
pwd # 각자 자신의 pwd 경로
code .

# 아래 extramounts 생략 시, myk8s-control-plane 컨테이너 sh/bash 진입 후 직접 git clone 가능
kind create cluster --name myk8s --image kindest/node:v1.23.17 --config - <<EOF
kind: Cluster
apiVersion: kind.x-k8s.io/v1alpha4
nodes:
- role: control-plane
  extraPortMappings:
  - containerPort: 30000 # Sample Application (istio-ingrssgateway) HTTP
    hostPort: 30000
  - containerPort: 30001 # Prometheus
    hostPort: 30001
  - containerPort: 30002 # Grafana
    hostPort: 30002
  - containerPort: 30003 # Kiali
    hostPort: 30003
  - containerPort: 30004 # Tracing
    hostPort: 30004
  - containerPort: 30005 # Sample Application (istio-ingrssgateway) HTTPS
    hostPort: 30005
  - containerPort: 30006 # TCP Route
    hostPort: 30006
  - containerPort: 30007 # New Gateway
    hostPort: 30007
  extraMounts: # 해당 부분 생략 가능
  - hostPath: /Users/gasida/Downloads/istio-in-action/book-source-code-master # 각자 자신의 pwd 경로로 설정
    containerPath: /istiobook
networking:
  podSubnet: 10.10.0.0/16
  serviceSubnet: 10.200.1.0/24
EOF

# 설치 확인
docker ps

# 노드에 기본 툴 설치
docker exec -it myk8s-control-plane sh -c 'apt update && apt install tree psmisc lsof wget bridge-utils net-tools dnsutils tcpdump ngrep iputils-ping git vim -y'

# (옵션) metrics-server
helm repo add metrics-server https://kubernetes-sigs.github.io/metrics-server/
helm install metrics-server metrics-server/metrics-server --set 'args[0]=--kubelet-insecure-tls' -n kube-system
kubectl get all -n kube-system -l app.kubernetes.io/instance=metrics-server
istio 설치
# myk8s-control-plane 진입 후 설치 진행
docker exec -it myk8s-control-plane bash
-----------------------------------
# (옵션) 코드 파일들 마운트 확인
tree /istiobook/ -L 1
혹은
git clone ... /istiobook

# istioctl 설치
export ISTIOV=1.17.8
echo 'export ISTIOV=1.17.8' >> /root/.bashrc

curl -s -L https://istio.io/downloadIstio | ISTIO_VERSION=$ISTIOV sh -
cp istio-$ISTIOV/bin/istioctl /usr/local/bin/istioctl
istioctl version --remote=false

# default 프로파일 컨트롤 플레인 배포
istioctl install --set profile=default -y

# 설치 확인 : istiod, istio-ingressgateway, crd 등
kubectl get istiooperators -n istio-system -o yaml
kubectl get all,svc,ep,sa,cm,secret,pdb -n istio-system
kubectl get cm -n istio-system istio -o yaml
kubectl get crd | grep istio.io | sort

# 보조 도구 설치
kubectl apply -f istio-$ISTIOV/samples/addons
kubectl get pod -n istio-system

# 빠져나오기
exit
-----------------------------------

# 실습을 위한 네임스페이스 설정
kubectl create ns istioinaction
kubectl label namespace istioinaction istio-injection=enabled
kubectl get ns --show-labels

# istio-ingressgateway 서비스 : NodePort 변경 및 nodeport 지정 변경 , externalTrafficPolicy 설정 (ClientIP 수집)
kubectl patch svc -n istio-system istio-ingressgateway -p '{"spec": {"type": "NodePort", "ports": [{"port": 80, "targetPort": 8080, "nodePort": 30000}]}}'
kubectl patch svc -n istio-system istio-ingressgateway -p '{"spec": {"type": "NodePort", "ports": [{"port": 443, "targetPort": 8443, "nodePort": 30005}]}}'
kubectl patch svc -n istio-system istio-ingressgateway -p '{"spec":{"externalTrafficPolicy": "Local"}}'
kubectl describe svc -n istio-system istio-ingressgateway

# NodePort 변경 및 nodeport 30001~30003으로 변경 : prometheus(30001), grafana(30002), kiali(30003), tracing(30004)
kubectl patch svc -n istio-system prometheus -p '{"spec": {"type": "NodePort", "ports": [{"port": 9090, "targetPort": 9090, "nodePort": 30001}]}}'
kubectl patch svc -n istio-system grafana -p '{"spec": {"type": "NodePort", "ports": [{"port": 3000, "targetPort": 3000, "nodePort": 30002}]}}'
kubectl patch svc -n istio-system kiali -p '{"spec": {"type": "NodePort", "ports": [{"port": 20001, "targetPort": 20001, "nodePort": 30003}]}}'
kubectl patch svc -n istio-system tracing -p '{"spec": {"type": "NodePort", "ports": [{"port": 80, "targetPort": 16686, "nodePort": 30004}]}}'

# Prometheus 접속 : envoy, istio 메트릭 확인
open http://127.0.0.1:30001

# Grafana 접속
open http://127.0.0.1:30002

# Kiali 접속 1 : NodePort
open http://127.0.0.1:30003

# (옵션) Kiali 접속 2 : Port forward
kubectl port-forward deployment/kiali -n istio-system 20001:20001 &
open http://127.0.0.1:20001

# tracing 접속 : 예거 트레이싱 대시보드
open http://127.0.0.1:30004


# 접속 테스트용 netshoot 파드 생성
cat <<EOF | kubectl apply -f -
apiVersion: v1
kind: Pod
metadata:
  name: netshoot
spec:
  containers:
  - name: netshoot
    image: nicolaka/netshoot
    command: ["tail"]
    args: ["-f", "/dev/null"]
  terminationGracePeriodSeconds: 0
EOF
실습 진행

이스티오 인그레스 게이트웨이는 클러스터 외부에서 내부로 들어오는 트래픽의 진입점을 제어하는 역할을 한다. 인그레스 게이트웨이는 Envoy 프록시 기반의 로드밸런서로 동작하며, 외부 트래픽을 받아 필요한 포트와 프로토콜을 지정해 노출한다. 하지만 실제 트래픽 라우팅(어떤 서비스로 전달할지)은 VirtualService 리소스를 통해 L7(애플리케이션 레이어)에서 세밀하게 제어한다.
즉, Gateway는 L4/L5 계층에서 트래픽을 받아들이고, VirtualService는 L7 계층에서 트래픽의 목적지와 라우팅 정책을 결정한다. 이 구조를 통해 이스티오는 외부 트래픽의 보안, 로드밸런싱, 가상 호스트 라우팅 등 다양한 네트워크 기능을 유연하게 제공한다.


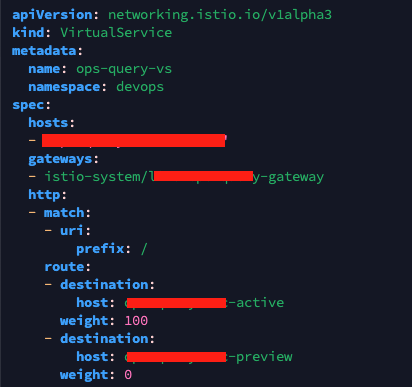
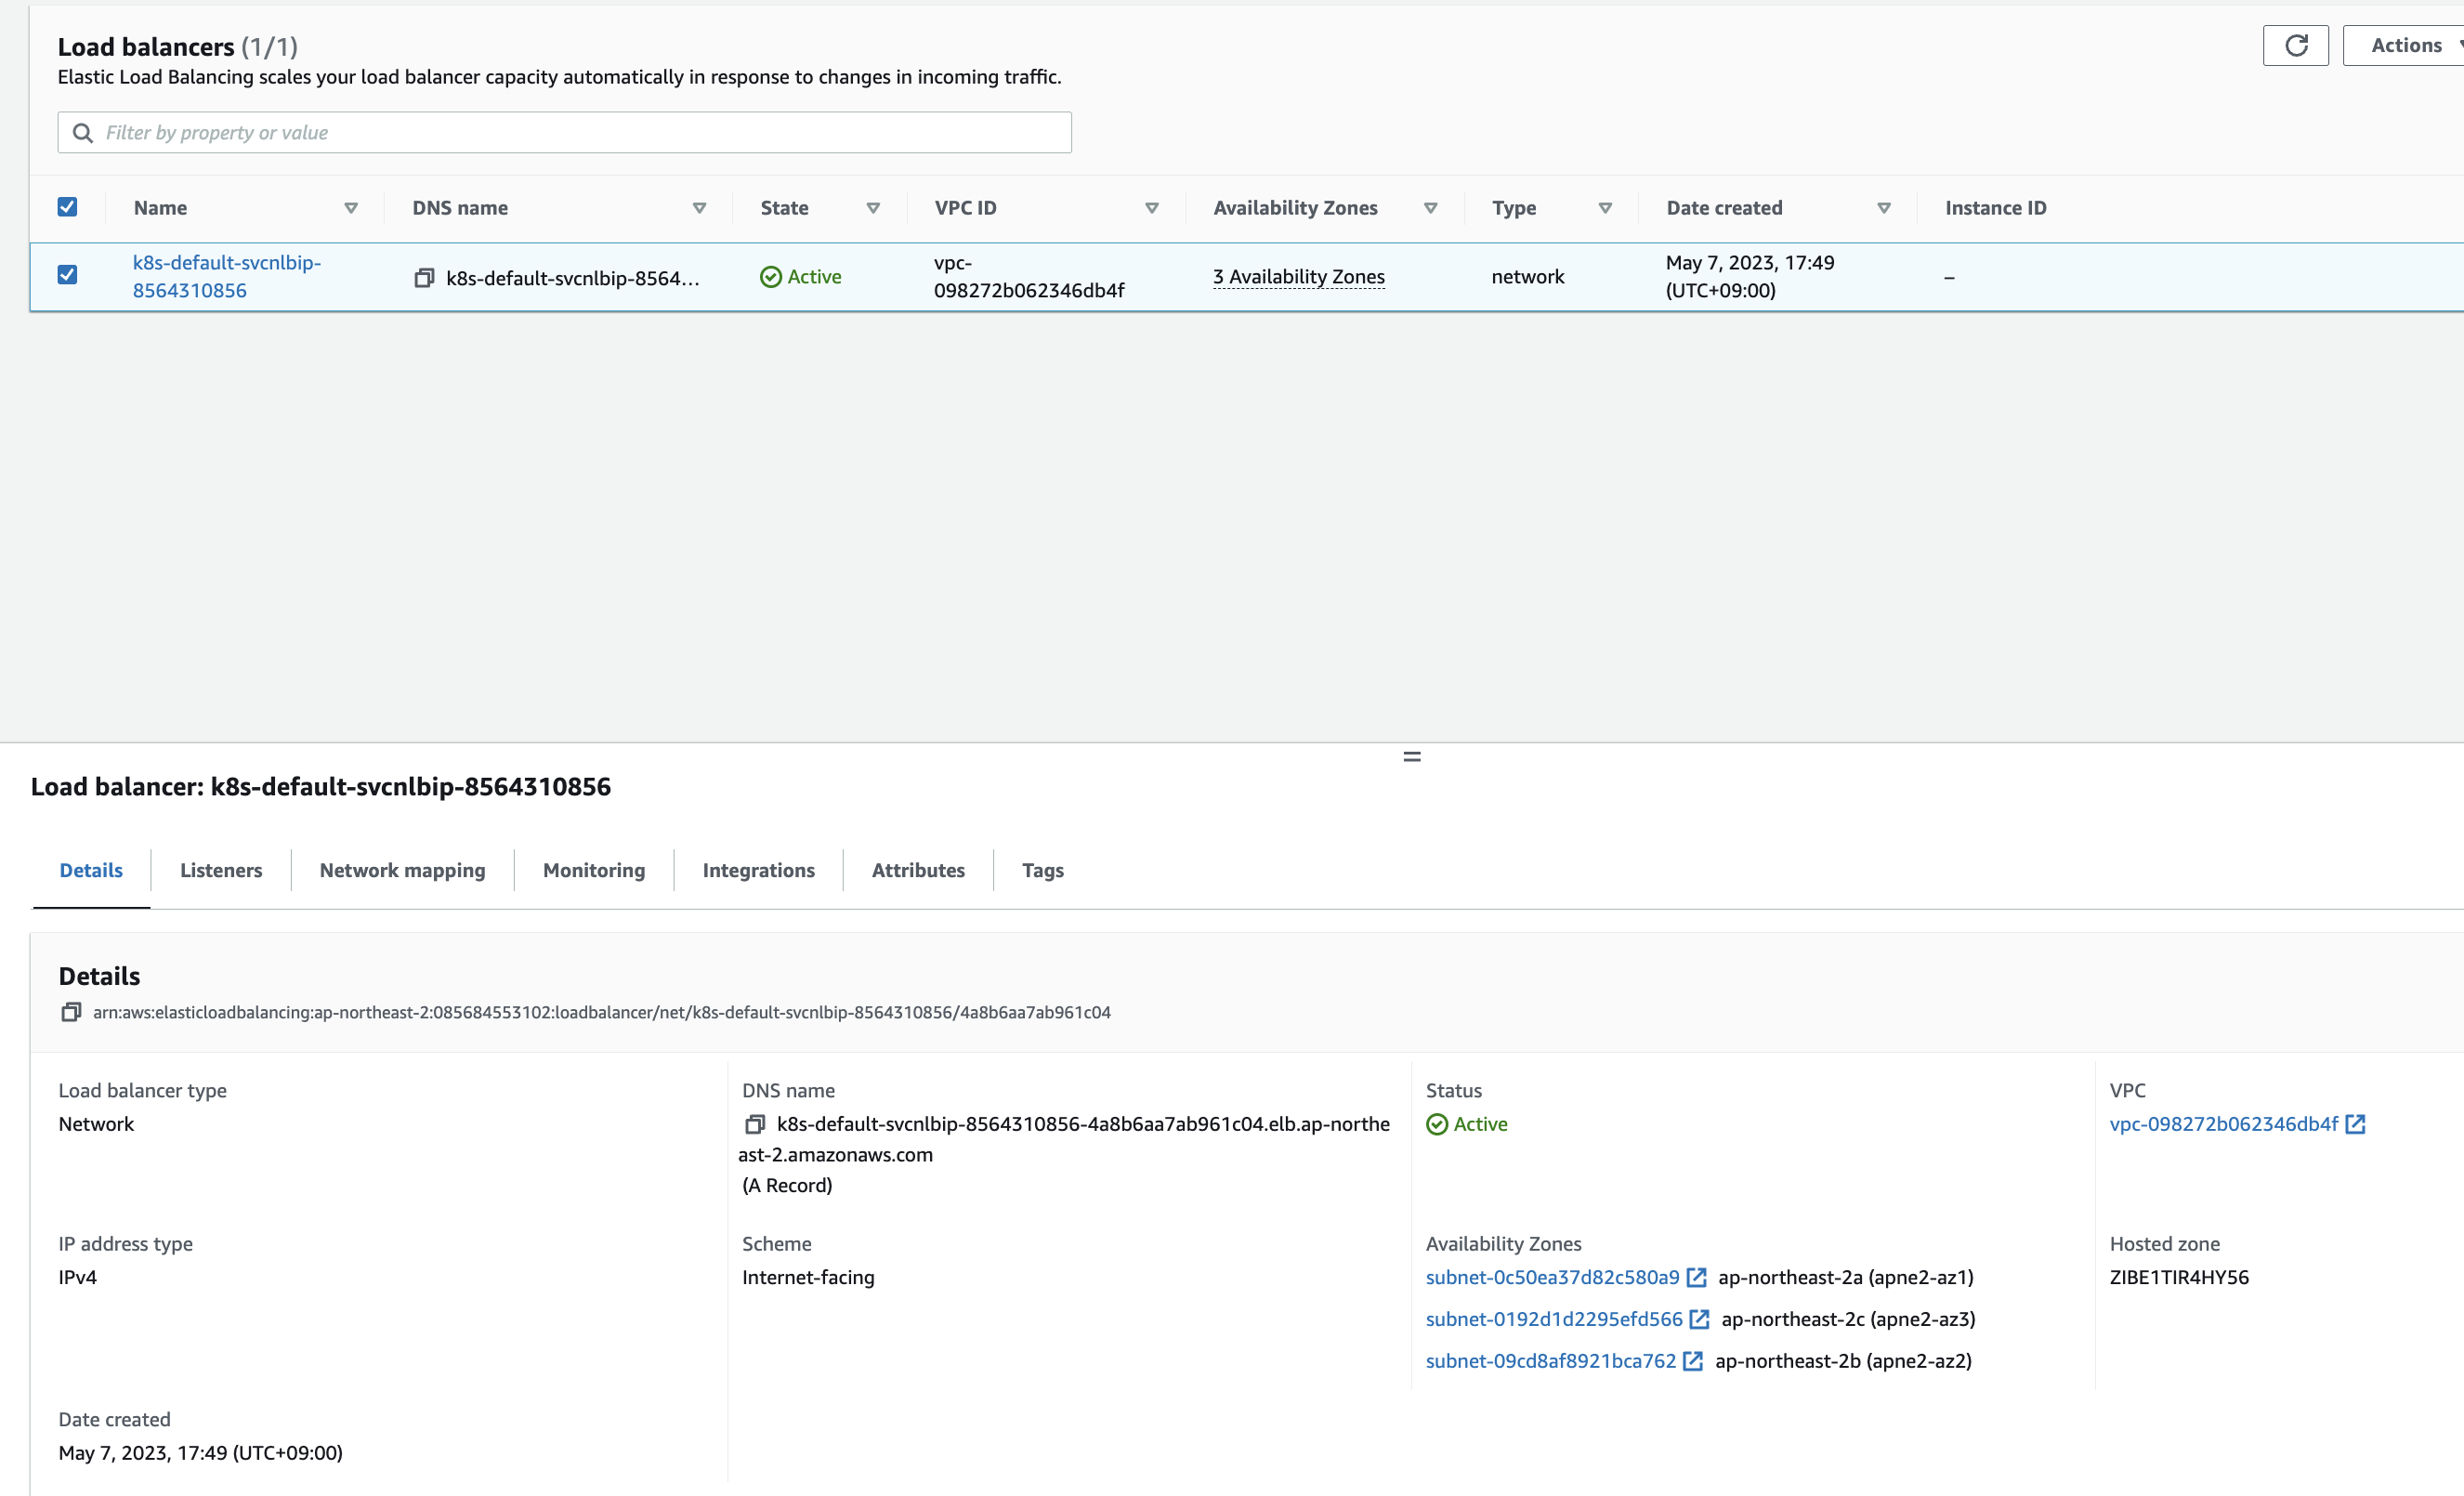
현재 운영중인 istio 환경 정보
apiVersion: networking.istio.io/v1alpha3
kind: Gateway
metadata:
  name: live-ops-query-gateway
  namespace: istio-system
spec:
  selector:
    istio: ingressgateway
  servers:
  - port:
      number: 80
      name: http
      protocol: HTTP
    hosts:
    - "ops-query.test.co.kr"
---
apiVersion: networking.istio.io/v1alpha3
kind: VirtualService
metadata:
  name: ops-query-vs
  namespace: devops
spec:
  hosts:
  - "ops-query.test.co.kr"
  gateways:
  - istio-system/live-ops-query-gateway
  http:
  - match:
    - uri:
        prefix: /
    route:
    - destination:
        host: ops-query-svc-active
      weight: 100
    - destination:
        host: ops-query-svc-preview
      weight: 0

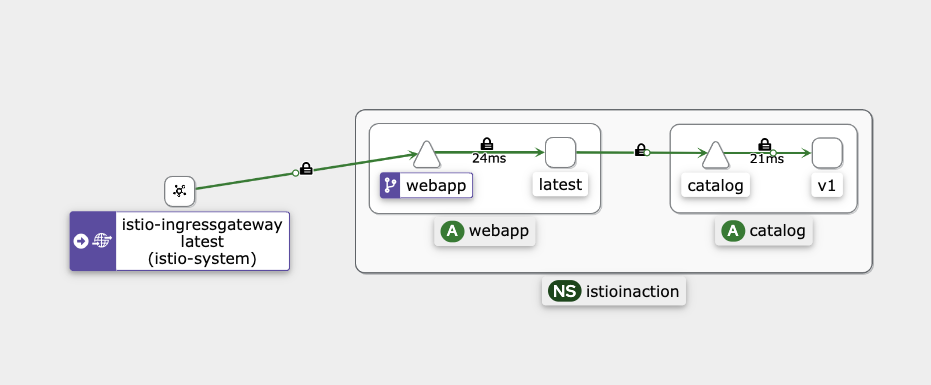
아래는 실습환경이다.


404 에러가 발생한다. 이는 host 헤더가 알맞지 않아서 발생하는 문제이다.

헤더 수정후 다시 입력하면 정상적으로 응답되는것을 알 수 있다.
securing gateway traffic 실습
실무환경에서는 앞단의 ALB에 인증서만 적용해두고 내부의 이스티오간 인증서는 적용돼있지 않은상태다. 추후 보안심사때 문제가 발생하면 그때 적용해야겠다....
어쨋든.. 실습 환경에서 현재 적용 돼 있는 인증서는 다음과 같다.

kubectl create -n istio-system secret tls webapp-credential \
--key ch4/certs/3_application/private/webapp.istioinaction.io.key.pem \
--cert ch4/certs/3_application/certs/webapp.istioinaction.io.cert.pem

 kubectl apply -f ch4/coolstore-gw-tls.yaml -n istioinaction
이제 위 명령어로 시크릿을 만들고 게이트웨이를 재배포한다.

그러면 위와같이 새로운 인증서가 추가된것을 볼 수 있다.

그리고 curl 로 접속 테스트를 하면 에러가 나는것을 볼 수 있다.
이는 서버(istio-ingressgateway 파드)에서 제공하는 인증서는 기본 CA 인증서 체인을 사용해 확인할 수 없다는 의미다.

다시 cacert 옵션을 줘서 테스트를 한다. 또 에러가 난다. 이번엔 Local host로 접속해서 발생한 문제이다.
echo "127.0.0.1 webapp.istioinaction.io" | sudo tee -a /etc/hosts위 명령어를 입력해서 임시로 dns 를 설정해준다.
다시 호출 테스트를 진행하면 정상적으로 접속되는것을 알 수 있다.

이번에는 https만 사용하도록 하는 리다이렉트 설정이다.
apiVersion: networking.istio.io/v1alpha3
kind: Gateway
metadata:
  name: coolstore-gateway
spec:
  selector:
    istio: ingressgateway
  servers:
  - port:
      number: 80
      name: http
      protocol: HTTP
    hosts:
    - "webapp.istioinaction.io"
    tls:
      httpsRedirect: true
  - port:
      number: 443
      name: https
      protocol: HTTPS
    tls:
      mode: SIMPLE
      credentialName: webapp-credential
    hosts:
    - "webapp.istioinaction.io"
이번엔 mTLS이다.
apiVersion: networking.istio.io/v1alpha3
kind: Gateway
metadata:
  name: coolstore-gateway
spec:
  selector:
    istio: ingressgateway
  servers:
  - port:
      number: 80
      name: http
      protocol: HTTP
    hosts:
    - "webapp.istioinaction.io"
  - port:
      number: 443
      name: https
      protocol: HTTPS
    tls:
      mode: MUTUAL # mTLS 설정
      credentialName: webapp-credential-mtls # 신뢰할 수 있는 CA가 구성된 자격 증명
    hosts:
    - "webapp.istioinaction.io"
다음과 같이 클라이언트 인증서 없이 에러가 발생한다.

클라이언트 인증서를 명시하면 정상적으로 동작하는것을 알 수 있다.

Serving multiple virtual hosts with TLS
이스티오 인그레스 게이트웨이는 동일한 HTTPS 포트(443)에서 각기 다른 인증서와 비밀 키를 사용해 여러 도메인(가상 호스트)의 트래픽을 동시에 처리할 수 있다.
apiVersion: networking.istio.io/v1alpha3
kind: Gateway
metadata:
  name: coolstore-gateway
spec:
  selector:
    istio: ingressgateway
  servers:
  - port:
      number: 443
      name: https-webapp
      protocol: HTTPS
    tls:
      mode: SIMPLE
      credentialName: webapp-credential
    hosts:
    - "webapp.istioinaction.io"
  - port:
      number: 443
      name: https-catalog
      protocol: HTTPS
    tls:
      mode: SIMPLE
      credentialName: catalog-credential
    hosts:
    - "catalog.istioinaction.io"

두개의 버추어 서비스를 처리하는것을 확인 할 수 있다. 이를 처리하는 플로우는 클라이언트가 게이트웨이(엔보이)로 HTTPS 연결을 시작하면, TLS 핸드셰이크의 ClientHello 단계에서 SNI(서버 이름 표시) 확장에 접근하려는 서비스의 도메인을 명시해 전달하고, 엔보이는 이 SNI 정보를 기반으로 올바른 인증서를 선택해 제시하고 해당 서비스로 트래픽을 라우팅한다.
TCP 트래픽에 대한 실습이다.
이스티오 게이트웨이는 TCP 기반 서비스도 외부에 노출할 수 있지만, HTTP처럼 세밀한 트래픽 제어나 고급 기능은 사용할 수 없다.
이는 엔보이가 프로토콜을 이해하지 못해 단순 TCP 프록시만 가능하기 때문이다.
클러스터 외부에서 내부 TCP 서비스를 이용하려면 게이트웨이에서 해당 포트를 노출하면 된다.
#
cat ch4/echo.yaml
apiVersion: apps/v1
kind: Deployment
metadata:
  name: tcp-echo-deployment
  labels:
    app: tcp-echo
    system: example
spec:
  replicas: 1
  selector:
    matchLabels:
      app: tcp-echo
  template:
    metadata:
      labels:
        app: tcp-echo
        system: example
    spec:
      containers:
        - name: tcp-echo-container
          image: cjimti/go-echo:latest
          imagePullPolicy: IfNotPresent
          env:
            - name: TCP_PORT
              value: "2701"
            - name: NODE_NAME
              valueFrom:
                fieldRef:
                  fieldPath: spec.nodeName
            - name: POD_NAME
              valueFrom:
                fieldRef:
                  fieldPath: metadata.name
            - name: POD_NAMESPACE
              valueFrom:
                fieldRef:
                  fieldPath: metadata.namespace
            - name: POD_IP
              valueFrom:
                fieldRef:
                  fieldPath: status.podIP
            - name: SERVICE_ACCOUNT
              valueFrom:
                fieldRef:
                  fieldPath: spec.serviceAccountName
          ports:
            - name: tcp-echo-port
              containerPort: 2701
---
apiVersion: v1
kind: Service
metadata:
  name: "tcp-echo-service"
  labels:
    app: tcp-echo
    system: example
spec:
  selector:
    app: "tcp-echo"
  ports:
    - protocol: "TCP"
      port: 2701
      targetPort: 2701

kubectl apply -f ch4/echo.yaml -n istioinaction

#
kubectl get pod -n istioinaction
NAME                                   READY   STATUS    RESTARTS   AGE
tcp-echo-deployment-584f6d6d6b-xcpd8   2/2     Running   0          27s
...
# tcp 서빙 포트 추가 : 편집기는 vi 대신 nano 선택 <- 편한 툴 사용
KUBE_EDITOR="nano"  kubectl edit svc istio-ingressgateway -n istio-system
...
  - name: tcp
    nodePort: 30006
    port: 31400
    protocol: TCP
    targetPort: 31400
...

# 확인
kubectl get svc istio-ingressgateway -n istio-system -o jsonpath='{.spec.ports[?(@.name=="tcp")]}'
{"name":"tcp","nodePort":30006,"port":31400,"protocol":"TCP","targetPort":31400}


# 게이트웨이 생성
cat ch4/gateway-tcp.yaml
apiVersion: networking.istio.io/v1alpha3
kind: Gateway
metadata:
  name: echo-tcp-gateway
spec:
  selector:
    istio: ingressgateway
  servers:
  - port:
      number: 31400
      name: tcp-echo
      protocol: TCP
    hosts:
    - "*"

kubectl apply -f ch4/gateway-tcp.yaml -n istioinaction
kubectl get gw -n istioinaction

# 에코 서비스로 라우팅하기 위해 VirtualService 리소스 생성
cat ch4/echo-vs.yaml
apiVersion: networking.istio.io/v1alpha3
kind: VirtualService
metadata:
  name: tcp-echo-vs-from-gw
spec:
  hosts:
  - "*"
  gateways:
  - echo-tcp-gateway
  tcp:
  - match:
    - port: 31400
    route:
    - destination:
        host: tcp-echo-service
        port:
          number: 2701

#
kubectl apply -f ch4/echo-vs.yaml -n istioinaction
kubectl get vs -n istioinaction
NAME                  GATEWAYS                HOSTS                          AGE
catalog-vs-from-gw    ["coolstore-gateway"]   ["catalog.istioinaction.io"]   44m
tcp-echo-vs-from-gw   ["echo-tcp-gateway"]    ["*"]                          6s
webapp-vs-from-gw     ["coolstore-gateway"]   ["webapp.istioinaction.io"]    3h59m


# mac 에 telnet 설치
brew install telnet

#
telnet localhost 30006
Trying ::1...
Connected to localhost.
Escape character is '^]'.
Welcome, you are connected to node myk8s-control-plane.
Running on Pod tcp-echo-deployment-584f6d6d6b-xcpd8.
In namespace istioinaction.
With IP address 10.10.0.20.
Service default.
hello istio! # <-- type here
hello istio! # <-- echo here

# telnet 종료하기 : 세션종료 Ctrl + ] > 텔넷 종료 quit


SNI passthrough 실습
이스티오 인그레스 게이트웨이는 TLS 연결을 종료하지 않고 SNI 호스트네임을 기반으로 TCP 트래픽을 라우팅하며, 백엔드 서비스에서 TLS 처리를 담당함으로써 다양한 레거시 애플리케이션 및 TCP 서비스를 서비스 메시에 통합할 수 있다.
apiVersion: networking.istio.io/v1alpha3
kind: Gateway
metadata:
  name: sni-passthrough-gateway
spec:
  selector:
    istio: ingressgateway
  servers:
  - port:
      number: 31400 #1 HTTP 포트가 아닌 특정 포트 열기
      name: tcp-sni
      protocol: TLS
    hosts:
    - "simple-sni-1.istioinaction.io" #2 이 호스트를 포트와 연결
    tls:
      mode: PASSTHROUGH #3 통과 트래픽으로 처리
# TLS 인증을 직접 처리하는 앱 배포. (gw는 route 만 처리, pass through )
cat ch4/sni/simple-tls-service-1.yaml
kubectl apply -f ch4/sni/simple-tls-service-1.yaml -n istioinaction
kubectl get pod -n istioinaction

# 기존 Gateway 명세(echo-tcp-gateway) 제거 : istio-ingressgateway의 동일한 port (31400, TCP)를 사용하므로 제거함
kubectl delete gateway echo-tcp-gateway -n istioinaction

# 신규 Gateway 설정
kubectl apply -f ch4/sni/passthrough-sni-gateway.yaml -n istioinaction
kubectl get gw -n istioinaction
# 두 번째 서비스 배포
cat ch4/sni/simple-tls-service-2.yaml
kubectl apply -f ch4/sni/simple-tls-service-2.yaml -n istioinaction

# gateway 설정 업데이트
cat ch4/sni/passthrough-sni-gateway-both.yaml
kubectl apply -f ch4/sni/passthrough-sni-gateway-both.yaml -n istioinaction

# VirtualService 설정
cat ch4/sni/passthrough-sni-vs-2.yaml
kubectl apply -f ch4/sni/passthrough-sni-vs-2.yaml -n istioinaction

# 호출테스트2
echo "127.0.0.1       simple-sni-2.istioinaction.io" | sudo tee -a /etc/hosts

curl https://simple-sni-2.istioinaction.io:30006 \
--cacert ch4/sni/simple-sni-2/2_intermediate/certs/ca-chain.cert.pem

Split gateway responsibilities 실습
여러 인그레스 게이트웨이를 배포하면 서비스별 요구사항이나 팀별로 트래픽 경로와 설정을 독립적으로 관리·격리할 수 있다.
apiVersion: install.istio.io/v1alpha1
kind: IstioOperator
metadata:
  name: my-user-gateway-install
  namespace: istioinaction
spec:
  profile: empty
  values:
    gateways:
      istio-ingressgateway:
        autoscaleEnabled: false
  components:
    ingressGateways:
    - name: istio-ingressgateway
      enabled: false
    - name: my-user-gateway
      namespace: istioinaction
      enabled: true
      label:
        istio: my-user-gateway
      k8s:
        service:
          ports:
            - name: tcp  # my-user-gateway 에서 사용할 포트 설정
              port: 30007
              targetPort: 31400
#
docker exec -it myk8s-control-plane bash
------------------------------------------
# istioinaction 네임스페이스에 Ingress gateway 설치
cat <<EOF > my-user-gateway-edited.yaml
apiVersion: install.istio.io/v1alpha1
kind: IstioOperator
metadata:
name: my-user-gateway-install
namespace: istioinaction
spec:
profile: empty
values:
gateways:
istio-ingressgateway:
autoscaleEnabled: false
components:
ingressGateways:
- name: istio-ingressgateway
enabled: false
- name: my-user-gateway
namespace: istioinaction
enabled: true
label:
istio: my-user-gateway
k8s:
service:
ports:
- name: tcp # my-user-gateway 에서 사용할 포트 설정
port: 31400
targetPort: 31400
nodePort: 30007 # 외부 접속을 위해 NodePort Number 직접 설정
EOF
# istioctl manifest generate -n istioinaction -f my-user-gateway-edited.yaml
istioctl install -y -n istioinaction -f my-user-gateway-edited.yaml
exit
------------------------------------------
# IstioOperator 확인
kubectl get IstioOperator -A
NAMESPACE NAME REVISION STATUS AGE
istio-system installed-state 5h48m
istioinaction my-user-gateway-install 17s
#
kubectl get deploy my-user-gateway -n istioinaction
NAME READY UP-TO-DATE AVAILABLE AGE
my-user-gateway 1/1 1 1 65s
# 포트 확인
kubectl get svc my-user-gateway -n istioinaction -o yaml
...
- name: tcp
nodePort: 30007
port: 31400
protocol: TCP
targetPort: 31400
...


Gateway injection
게이트웨이 주입(gateway injection)을 사용하면, 사용자가 IstioOperator 리소스 전체 권한 없이도 미완성(서브된) 게이트웨이 Deployment 리소스를 배포할 수 있고, Istio가 나머지 설정을 자동으로 채워준다. 이 방식은 사이드카 주입과 유사하게, 각 팀이 필요한 최소한의 리소스만 정의하면 Istio가 필요한 프록시와 설정을 자동으로 붙여준다.
apiVersion: apps/v1
kind: Deployment
metadata:
  name: my-user-gateway-injected
  namespace: istioinaction
spec:
  selector:
    matchLabels:
      ingress: my-user-gateway-injected
  template:
    metadata:
      annotations:
        sidecar.istio.io/inject: "true" #1 주입 활성화
        inject.istio.io/templates: gateway #2 gateweay 템플릿
      labels:
        ingress: my-user-gateway-injected
    spec:
      containers:
      - name: istio-proxy #3 반드시 이 이름이어야 한다
        image: auto #4 미완성 이미지
...
Ingress gateway access logs 실습
이스티오 데모 프로필에서는 엔보이 프록시의 액세스 로그가 표준 출력으로 기록되어 컨테이너 로그를 통해 쉽게 확인할 수 있다.
#
kubectl get cm -n istio-system istio -o yaml
data:
  mesh: |-
    defaultConfig:
      discoveryAddress: istiod.istio-system.svc:15012
      proxyMetadata: {}
      tracing:
        zipkin:
          address: zipkin.istio-system:9411
    enablePrometheusMerge: true
    rootNamespace: istio-system
    trustDomain: cluster.local
  meshNetworks: 'networks: {}'
..

#
docker exec -it myk8s-control-plane bash
------------------------------------------
# 표준 출력 스트림으로 출력하도록 accessLogFile 속성을 변경
istioctl install --set meshConfig.accessLogFile=/dev/stdout
y 입력

exit
------------------------------------------

# configmap 에 mesh 바로 아래에 accessLogFile 부분 추가됨
kubectl get cm -n istio-system istio -o yaml
...
  mesh: |-
    accessLogFile: /dev/stdout
...

# 애플리케이션 호출에 대한 로그도 출력됨!
kubectl stern -n istioinaction -l app=webapp -c istio-proxy
webapp-7685bcb84-h5knf istio-proxy [2025-04-14T09:30:47.764Z] "GET /items HTTP/1.1" 200 - via_upstream - "-" 0 502 1 1 "172.18.0.1" "beegoServer" "4c10dba4-f49a-4b58-9805-ac30515dd417" "catalog.istioinaction:80" "10.10.0.8:3000" outbound|80||catalog.istioinaction.svc.cluster.local 10.10.0.9:60052 10.200.1.251:80 172.18.0.1:0 - default
webapp-7685bcb84-h5knf istio-proxy [2025-04-14T09:30:48.805Z] "GET /items HTTP/1.1" 200 - via_upstream - "-" 0 502 6 6 "172.18.0.1" "beegoServer" "7733f4d0-6e3a-4138-a126-fe25c30e51f4" "catalog.istioinaction:80" "10.10.0.8:3000" outbound|80||catalog.istioinaction.svc.cluster.local 10.10.0.9:60898 10.200.1.251:80 172.18.0.1:0 - default
...
운영 환경에서는 트래픽과 로그량이 많기 때문에, 텔레메트리 API를 이용해 필요한 워크로드에만 액세스 로그를 selectively 활성화하는 것이 효율적이다.
apiVersion: telemetry.istio.io/v1alpha1
kind: Telemetry
metadata:
  name: ingress-gateway
  namespace: istio-system
spec:
  selector:
    matchLabels:
      app: istio-ingressgateway #1 레이블과 일치하는 파드는 텔레메트리 설정을 가져온다
  accessLogging:
  - providers:
    - name: envoy #2 액세스 로그를 위한 프로바이더 설정
    disabled: false #3 disable 를 false 로 설정해 활성화한다
Reducing gateway configuration
이스티오는 기본적으로 모든 프록시가 메시 내 모든 서비스를 알도록 설정되어 있어 서비스가 많아지면 프록시 설정이 비대해지고 성능 및 확장성 문제가 발생할 수 있다. 이를 해결하기 위해 게이트웨이 프록시에는 필요한 설정만 포함하도록 "게이트웨이 설정 잘라내기" 기능을 명시적으로 활성화할 수 있다.
개인적으로 오늘 스터디에서 배운것중 가장 필요했던것이다. 일전에 istio 설정 잘못해서 서비스 연결이 제대로 안됐었는데, 디버깅 하기가 너무 힘들었다. 해당 설정때문에 앞으로 좀 더 수월해질듯 하다.
apiVersion: install.istio.io/v1alpha1
kind: IstioOperator
metadata:
  name: control-plane
spec:
  profile: minimal
  components:
    pilot:
      k8s:
        env:
        - name: PILOT_FILTER_GATEWAY_CLUSTER_CONFIG
          value: "true"
  meshConfig:
    defaultConfig:
      proxyMetadata:
        ISTIO_META_DNS_CAPTURE: "true"
enablePrometheusMerge: true'job > devops' 카테고리의 다른 글
| istio-1 (0) | 2025.04.08 |
|---|---|
| taskfile (0) | 2024.03.10 |
| kubewarden (0) | 2024.01.20 |
| openfunction (0) | 2023.12.01 |
| git common flow(또는 gitlab flow) 브랜치 전략에 대한 설명 (0) | 2023.06.13 |


